RCRR Technical Report: Which Document Conversion Systems Preserve the Meaning of Japanese IR Materials?
The full RCRR technical report: 14 systems in the primary comparison, 99 real Japanese IR pages, 1,410 verified questions, measured end to end. Method, worked examples, statistics, provenance, limitations: everything needed to challenge the results.

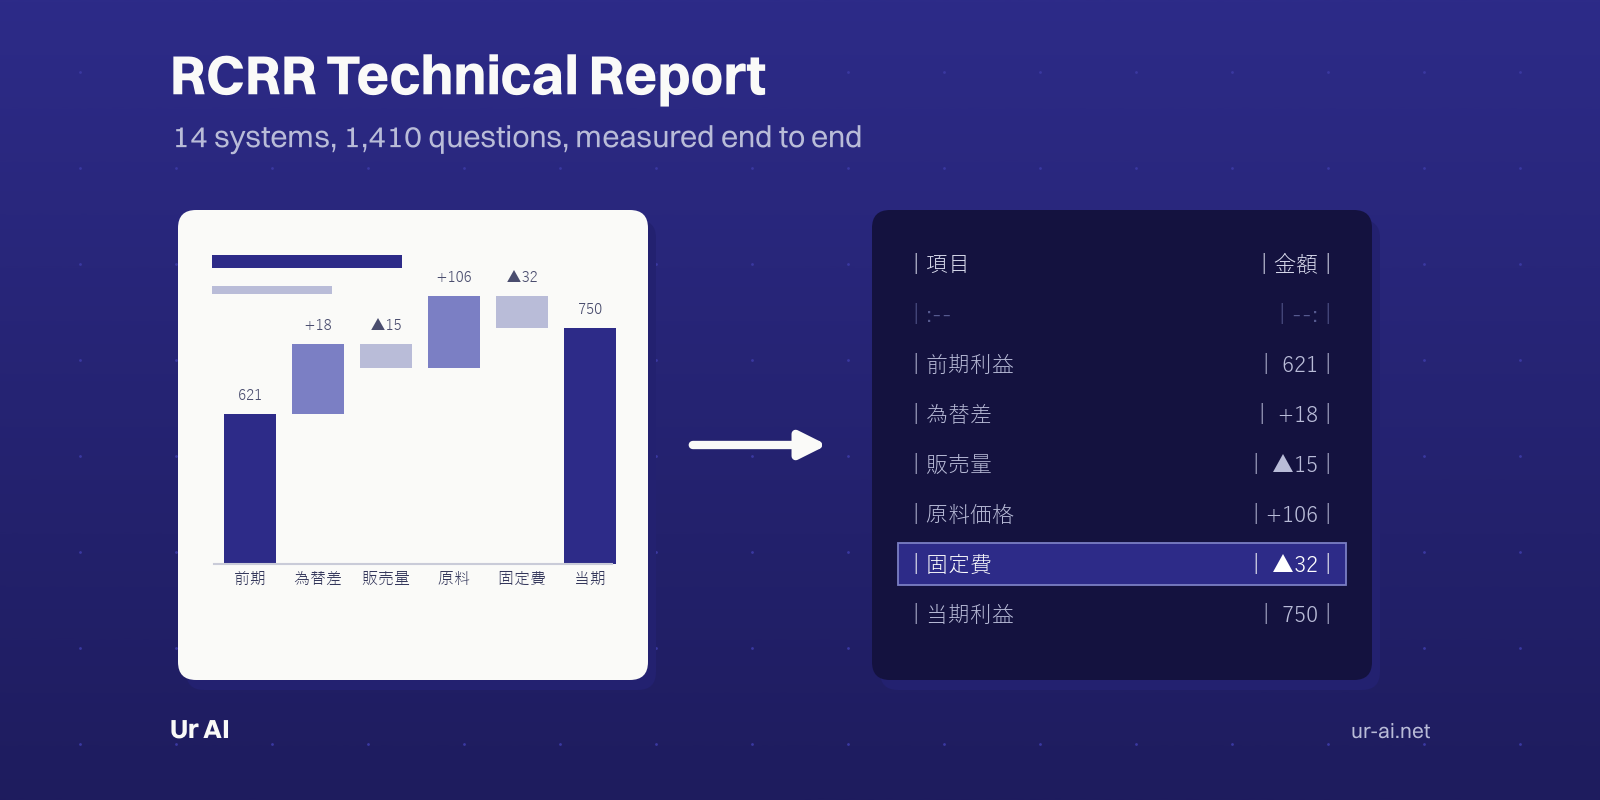
This is the full technical report for the RCRR Benchmark. We measured 14 document conversion systems, from commercial OCR products through open-weight models to frontier vision-language model (VLM) APIs, against the single criterion that actually matters for enterprise AI: after a page of Japanese IR material is converted to Markdown, can an AI still answer the questions a human could answer from the original image?
Across all 1,410 verified questions, scores ranged from 20.2 to 94.6. On questions probing chart structure (which value belongs to which series, segment, or fiscal year), OCR products retain only about one-sixth of the meaning (17–46), while VLM-based conversion retains 94–98.
Ur AI’s document conversion system Nebula was measured in both of its configurations. Nebula Frontier, which runs frontier VLM APIs inside Ur AI’s conversion pipeline, scored 94.4 overall: statistically tied (no significant difference) with the latest frontier VLM APIs (Fable 5 at 94.6, GPT-5.6 Sol at 94.0, Gemini 3.1 Pro at 93.7), the highest text-and-tables score of any system evaluated (94.3), and significantly above Microsoft Azure Document Intelligence (88.2). Nebula Sovereign, a fine-tuned Qwen3-VL-32B running entirely on self-hosted GPUs, scored 87.3: statistically equivalent to Azure DI, within 7.1 points of the frontier configuration, with no document ever leaving customer-managed infrastructure. Fine-tuning alone, measured on the identical harness, lifted the base model by +6.2 points overall (+8.1 on text and tables).
Key findings
- What separates document AI systems is not character recognition accuracy but how much meaning survives. Overall scores on the same pages ranged from 20.2 to 94.6.
- Text and tables are mostly solved; charts decide the market. On the 207 chart questions, frontier VLM APIs retain 94–98 and Nebula Frontier retains 94.7; Nebula Sovereign (77.3) outperformed every document OCR product evaluated (Azure DI: 69.1); legacy pipelines remain at 17–46.
- Nebula Frontier is statistically tied with the latest frontier VLM APIs (−0.2 vs Fable 5, +0.4 vs GPT-5.6 Sol, +0.7 vs Gemini 3.1 Pro), and its 94.3 on text and tables is the highest of any system, the PDF text-layer fusion in the pipeline paying off on dense financial tables. Against Azure DI the margin is +6.2 [+4.0, +8.5], significant.
- A self-hosted custom-weights model now stands level with the best commercial cloud OCR: Nebula Sovereign 87.3 vs Azure DI 88.2 is a statistical tie, with every document staying on customer-managed infrastructure.
- The effect of fine-tuning is a measurement, not a claim: +6.2 overall, +8.1 on text and tables, with pages, questions, Reader, and Judge all held constant. The only difference is the weights.
1. Why we built this benchmark
Japanese IR materials (earnings presentations, securities reports) are slide-format pages whose substance lives in dense tables, annotated charts, and the structure itself. For an LLM to answer questions about these pages, the images must first be converted to text. Every production RAG pipeline includes this conversion, yet almost no one measures what the conversion breaks.
Character-accuracy metrics cannot see this problem: every printed token can be transcribed perfectly while the association between a number and its bar is lost. So we measure downstream. In RCRR (reading-comprehension recovery), a Reader model answers verified questions using only the converted Markdown, and an independent Judge model scores the answers against gold. The score represents the share of answerable meaning that survived conversion.
2. What RCRR captures: a worked example
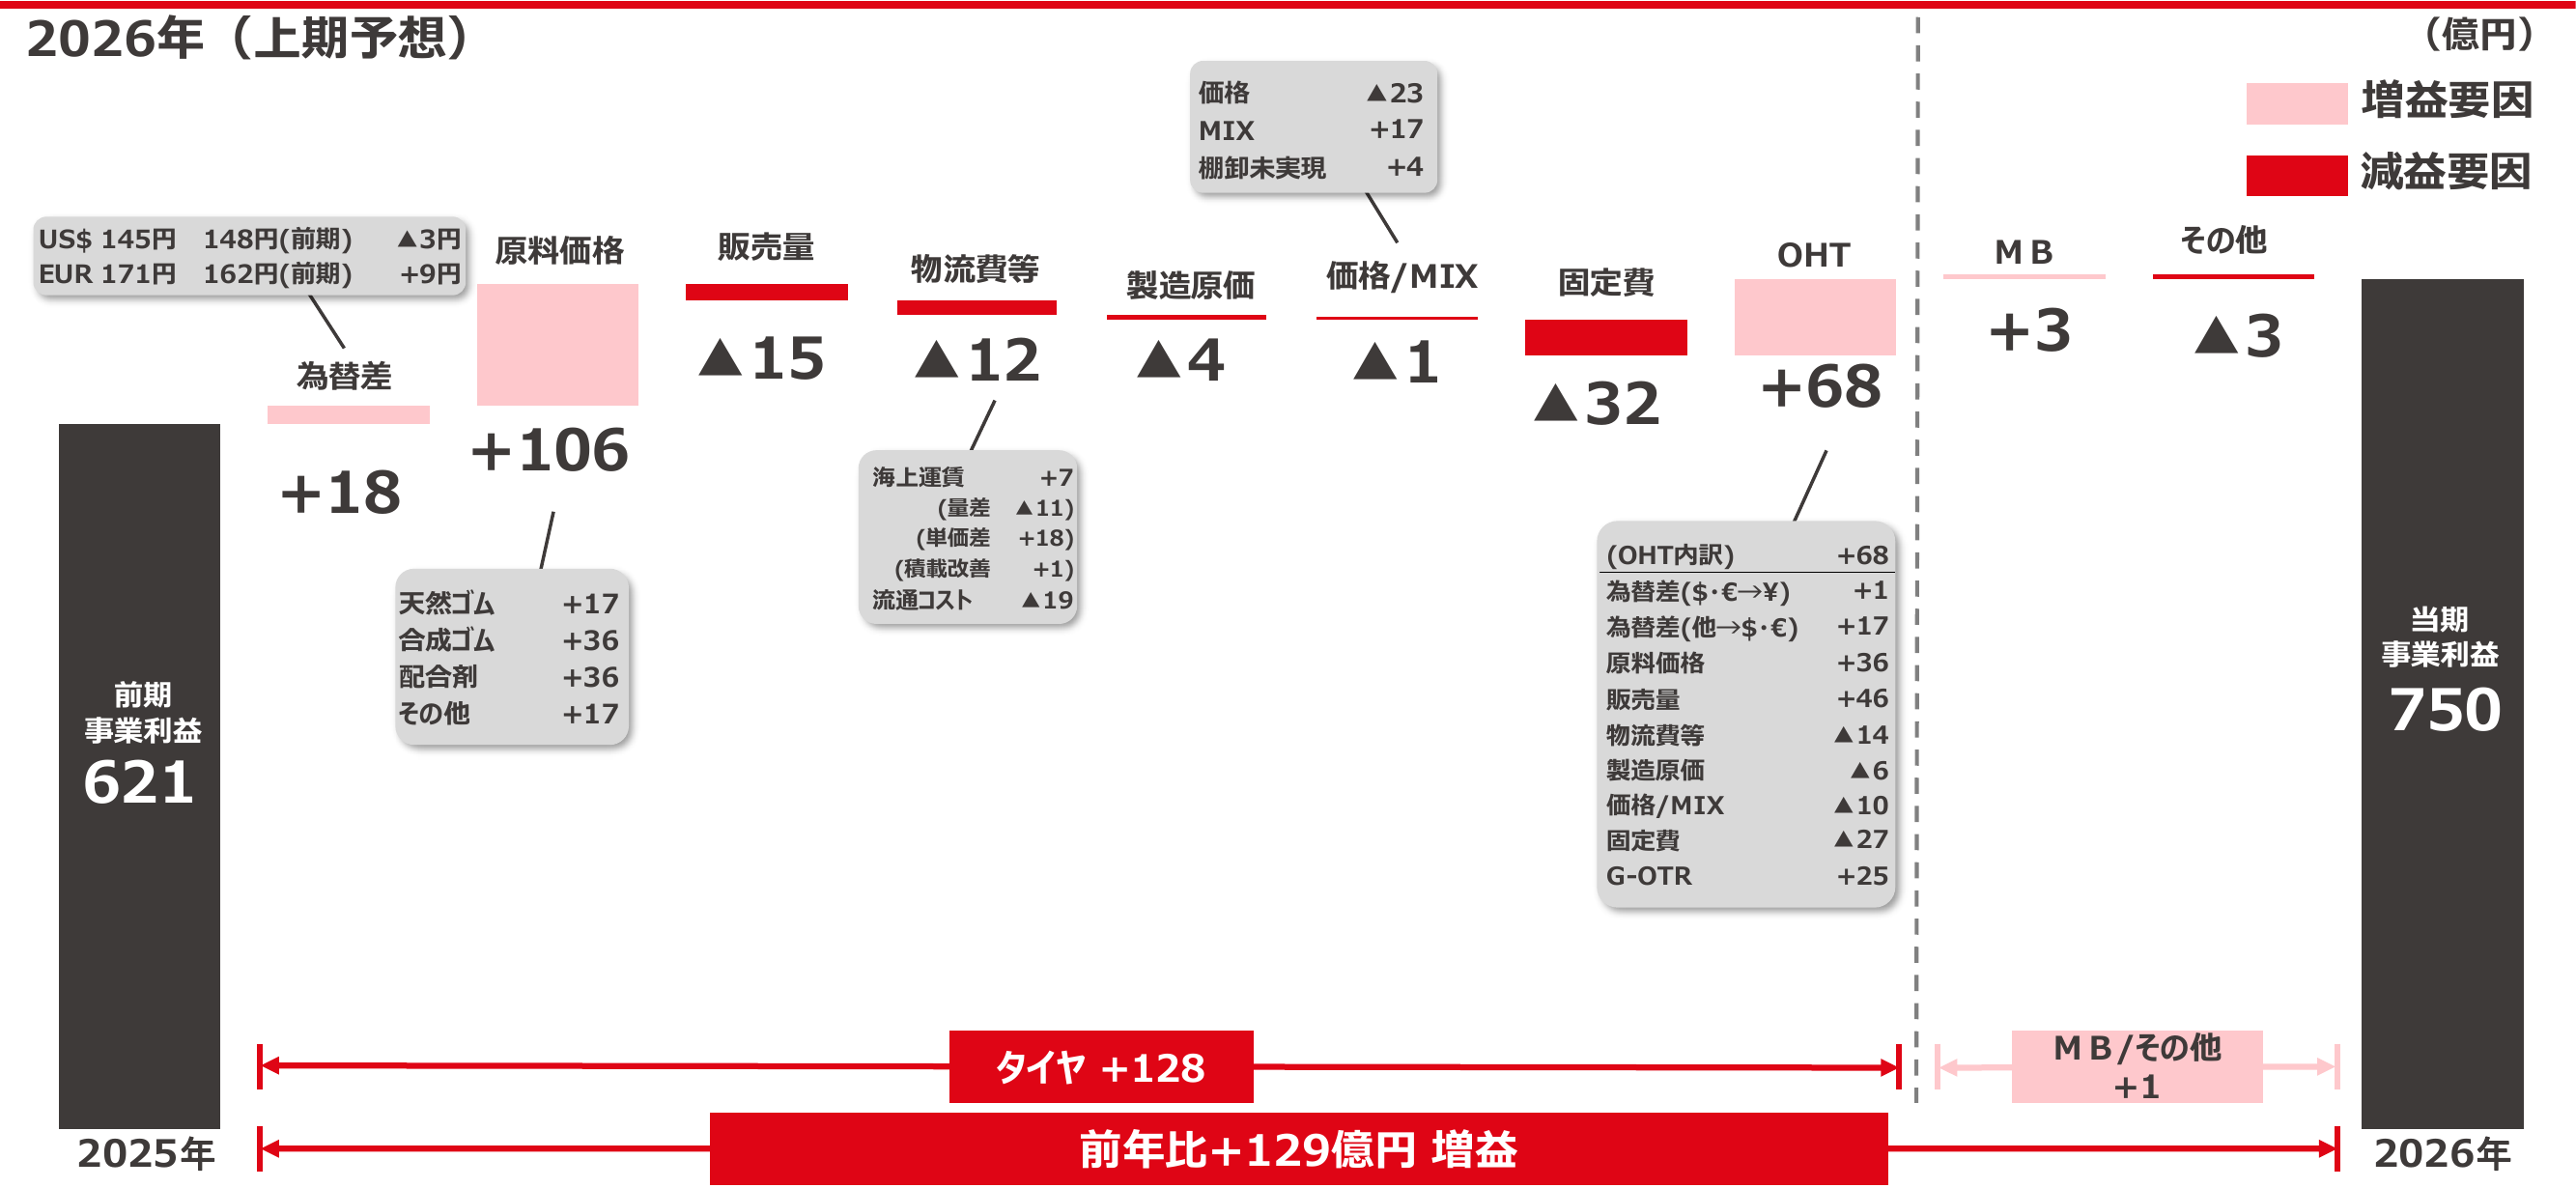
Q: Among the drivers of the FY2026 first-half business-profit variance, which item has the largest negative impact? Gold: fixed costs (固定費). Six of the ten steps are decreases, and the largest is fixed costs ▲32. The trap sits at the top of the page: a callout box decomposes the ▲1 price/MIX step into price ▲23, MIX +17, and unrealized inventory +4. Looking at the page directly, there is no way to misread this: ▲23 is merely one component of a ▲1 step. It can only masquerade as the page’s largest decrease if the conversion fails to preserve the hierarchy. The conversions below fail in exactly these ways.
Azure Document Intelligence: every character survives; every connection is lost
価格 / ▲23 / +17 / … / 原料価格 / 販売量 / 物流費等 / … / 製造原価 / 価格/MIX / 固定費 / OHT / 為替差 / ▲ 15 12 ▲4 1 +3 3 +18 +106 32 +68 (actual output excerpt)
Labels arrive in one cluster, values in another, and even the ▲ sign of fixed costs is severed from its 32. Almost the only label–value adjacency that survives is the callout’s 価格 ▲23. The Reader stitches that adjacency back together and answers price/MIX (▲2.3 billion yen): a confident answer with the wrong item and the wrong amount.
Nebula Sovereign: structure survives, but the callout is promoted to a table
| 項目 | 金額(億円) | 要因分類 |
|---|---|---|
| 価格 | ▲23 | 減益要因 |
| MIX | +17 | 増益要因 |
| 棚卸未実現 | +4 | 増益要因 |
Excerpt of the actual conversion. The waterfall itself, including fixed costs ▲32, is correctly reconstructed later in the output, but this callout has been promoted to a standalone driver table.
Faced with two structures claiming to be “the driver breakdown,” the Reader trusts the explicit table and answers with the component-level 価格 rather than the step. The base model this system was fine-tuned from answers this question correctly. This is the chart-attribution regression measured in §6 and targeted in §7.
Nebula Frontier: structure, labels, and hierarchy all survive
| 順序 | 項目 | 種別 | 金額 |
|---|---|---|---|
| 1 | 前期 事業利益 | 開始 | 621 |
| 2 | 為替差 | 増益要因 | +18 |
| 4 | 販売量 | 減益要因 | ▲15 |
| 7 | 価格/MIX | 減益要因 | ▲1 |
| 8 | 固定費 | 減益要因 | ▲32 |
| 12 | 当期 事業利益 | 終了 | 750 |
Excerpt of the actual conversion. The callout stays subordinate, explicitly marked as a breakdown of the price/MIX step, so ▲23 remains bound to the step it decomposes.
| System | Answer | Score | Failure type |
|---|---|---|---|
| Nebula Frontier | Fixed costs (▲32) | 2 | none |
| GPT-5.6 Sol / Fable 5 / Gemini 3.1 Pro | Fixed costs | 2 | none |
| Qwen3-VL-32B base | Fixed costs | 2 | none |
| Azure DI | Price/MIX (▲2.3bn yen) | 0 | disassociation |
| Nebula Sovereign | Price | 0 | misattribution |
| Textract / Docling | No information | 0 | omission |
Scores on this question by system type. Omission: the fact never reaches the Markdown. Disassociation: characters survive, connections do not. Misattribution: structure survives, one association is silently wrong, the most expensive failure, because it returns a confident wrong answer instead of a refusal.
3. Methodology
- Corpus: 99 real single-page documents from publicly available TDnet disclosures (50 table-centric, 49 chart-centric). Excerpts appear solely for evaluation and explanation; all rights belong to the issuers.
- Input condition: frontier VLM APIs are evaluated on page-image inputs (300-dpi renders), the practical deployment mode, since real workloads parse 100-plus-page PDFs page by page. OCR products use their native PDF ingestion. Reference measurements through vendor PDF-file ingestion (e.g., GPT-5.6 Sol at 94.6) are included in the public data.
- Questions: 1,410 total. Core (1,053): value lookups through multi-step reasoning. Mapping (357): association questions authored from page images, including the chart-mapping subset (207) sourced exclusively from chart ink. All mapping questions are human-reviewed. Every question belongs to one of two axes, text & tables (1,203) or charts (207), which together compose the overall score.
- Quality controls before any scoring: a fairness audit of every question by two independent model families; a self-containment filter (73 questions removed); a no-document contamination check (zero questions answerable from memory); and exclusion of geometry-dependent questions.
- Protocol: the Reader answers one question per call from the Markdown alone and refuses when information is absent. The Judge scores each answer 0/1/2 on a calibrated rubric with explicit rules for Japanese financial units, “not stated” golds, and language neutrality.
- Statistics: 95% cluster-bootstrap confidence intervals, resampling pages rather than questions. “Statistically tied” means the paired page-level difference interval straddles zero.
Gold provenance: how Fable 5 and Gemini 3.1 Pro are handled
The golds were created with VLM assistance: text-and-table golds with Gemini 3.1 Pro, chart golds with Fable 5’s vision capability, all passing machine validation and human review. The evaluation configuration deliberately breaks provenance bias: the Reader is a third family, GPT-5.4-mini (the families that authored the golds never read the documents), and the Judge (Gemini 3.5 Flash) is a different family from the Reader, so no model grades its own answer.
Parsers from the two gold-authoring families were measured under identical conditions and appear in the primary table. However, mechanisms exist that could favor a gold-authoring family’s parser independently of true conversion quality: question-selection bias, gold phrasing, and adjudication of gold errors by the authoring family. We could not measure the size of these effects; they may be small. The affected rows carry a provenance marker, the body claims are built on provenance-clean comparisons, and Fable 5’s chart score (98.1), the chart-gold author’s own, should be read as a reference ceiling. Judging is unaffected: the Judge only compares the gold with the GPT-family Reader’s answer, so gold provenance cannot advantage any parser through it.
4. Results: all 14 systems
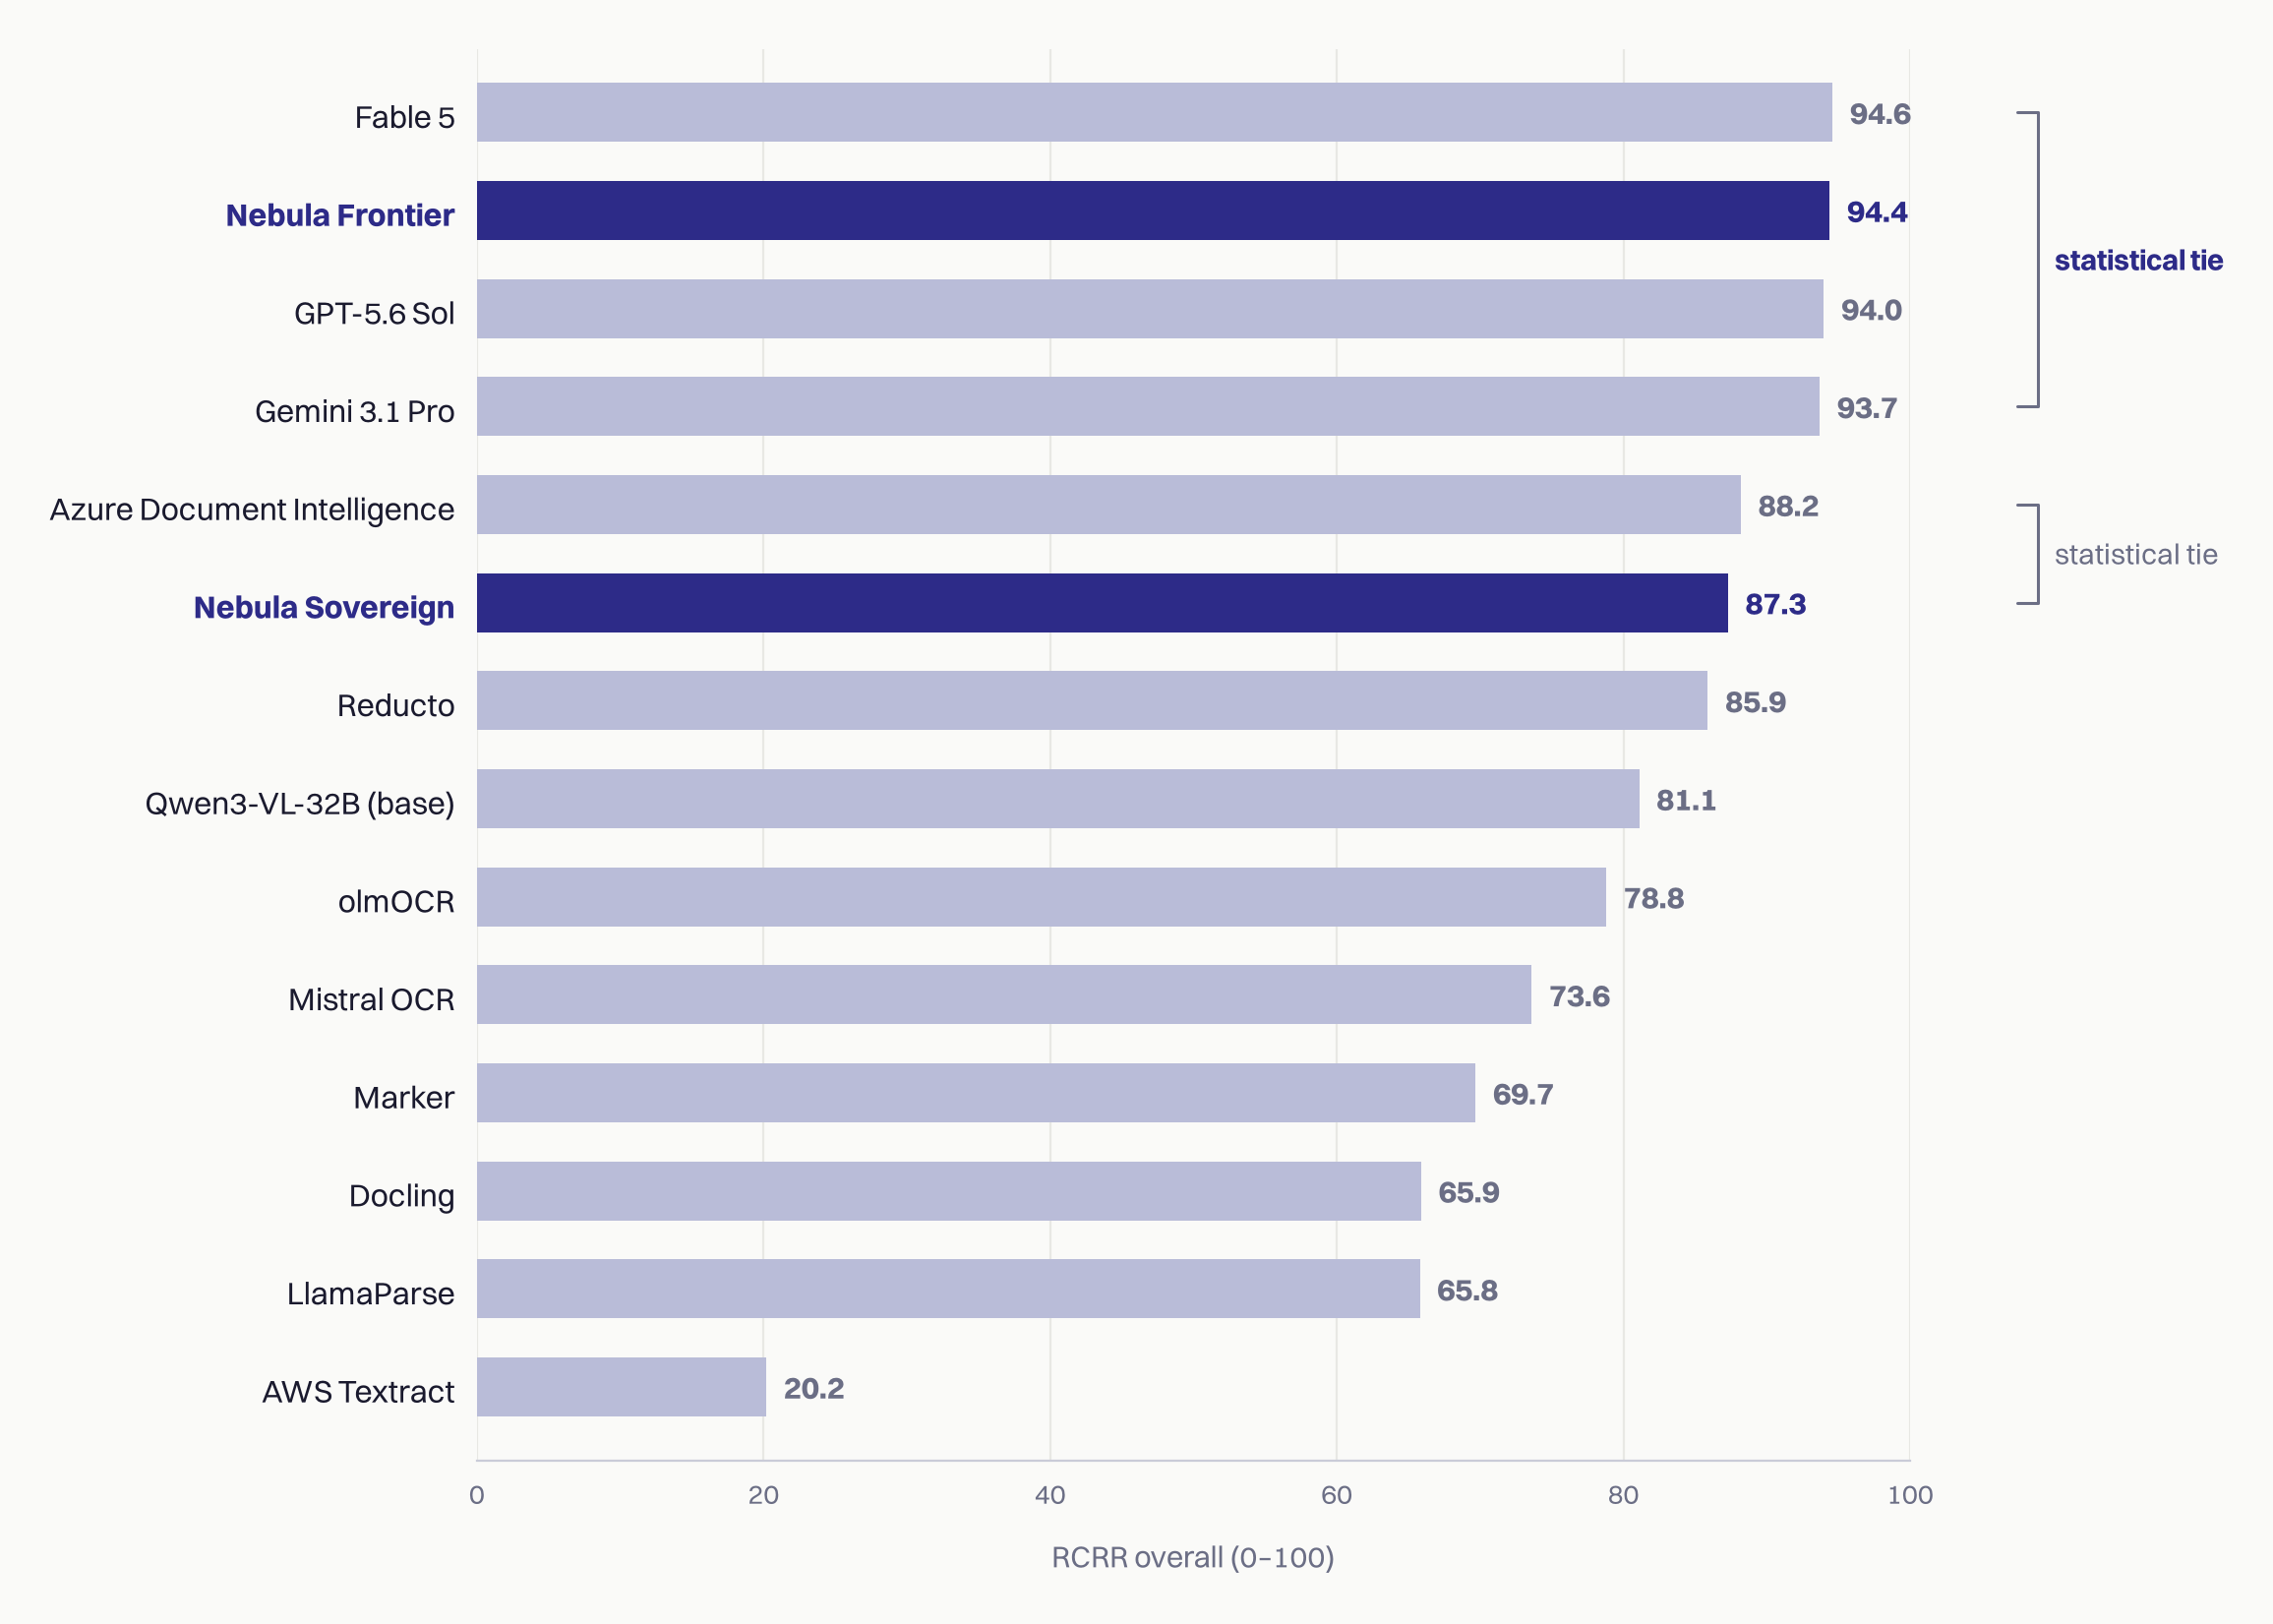
| # | System | Type | Overall (1,410) | Text & tables (1,203) | Charts (207) |
|---|---|---|---|---|---|
| 1 | Fable 5 †§ | VLM API (image input) | 94.6 [93.2, 95.8] | 94.0 | 98.1 |
| 2 | Nebula Frontier ¹ | Ur AI orchestration over frontier VLM APIs | 94.4 [93.0, 95.7] | 94.3 | 94.7 |
| 3 | GPT-5.6 Sol † | VLM API (image input) | 94.0 [92.6, 95.2] | 93.4 | 97.1 |
| 4 | Gemini 3.1 Pro †§ | VLM API (image input) | 93.7 [92.1, 95.2] | 93.1 | 97.1 |
| 5 | Azure Document Intelligence | OCR product | 88.2 [85.5, 90.6] | 91.5 | 69.1 |
| 6 | Nebula Sovereign ¹ | Ur AI custom-weights model, self-hosted | 87.3 [84.3, 89.9] | 89.0 | 77.3 |
| 7 | Reducto | OCR product | 85.9 [82.6, 88.8] | 88.5 | 70.8 |
| 8 | Qwen3-VL-32B (base) | Open weights | 81.1 [77.2, 84.5] | 80.9 | 82.4 |
| 9 | olmOCR | Open weights | 78.8 [75.2, 82.3] | 84.3 | 46.4 |
| 10 | Mistral OCR | OCR product | 73.6 [68.1, 78.6] | 82.4 | 22.2 |
| 11 | Marker | Open source | 69.7 [63.9, 75.1] | 78.6 | 17.6 |
| 12 | Docling | Open source | 65.9 [60.3, 71.0] | 74.2 | 17.1 |
| 13 | LlamaParse | OCR product | 65.8 [60.7, 70.6] | 71.3 | 34.1 |
| 14 | AWS Textract ‡ | OCR product | 20.2 [17.2, 23.5] | 20.7 | 17.4 |
¹ Nebula Frontier = frontier orchestration (whole-page conversion, PDF text-layer fusion); Nebula Sovereign = fully self-hosted, fine-tuned. † General-purpose VLM API with a detailed Japanese-IR conversion prompt, page-image input. § Gold-provenance family (see §3). ‡ Textract does not natively output Markdown; a standard conversion of its block output was used.
- Nebula Frontier vs the frontier VLM APIs: −0.2 [−1.2, +0.8] vs Fable 5, +0.4 [−0.8, +1.6] vs GPT-5.6 Sol, +0.7 [−0.6, +2.1] vs Gemini 3.1 Pro: the top of the table is a four-system statistical-equivalence group. Vs Azure DI: +6.2 [+4.0, +8.5], significant.
- Text-and-tables leader: Nebula Frontier’s 94.3 is the highest of all systems (+2.8 [+1.3, +4.4] vs Azure DI, significant).
- Between the two Nebula tiers: +7.1 [+4.9, +9.6], significant: the report’s primary frontier gap, measured against our own product.
- Nebula Sovereign vs Azure DI is a trade: Azure slightly ahead on text and tables (−2.5, significant), Nebula ahead on charts (+8.2 [+0.0, +16.6]), overall a statistical tie (−1.0 [−3.8, +1.8]).
- Fine-tuning effect (Sovereign vs base Qwen3-VL-32B): +6.2 [+2.1, +10.3] overall, +8.1 [+4.0, +12.4] on text & tables, with everything else held constant.
5. Charts decide the document AI market
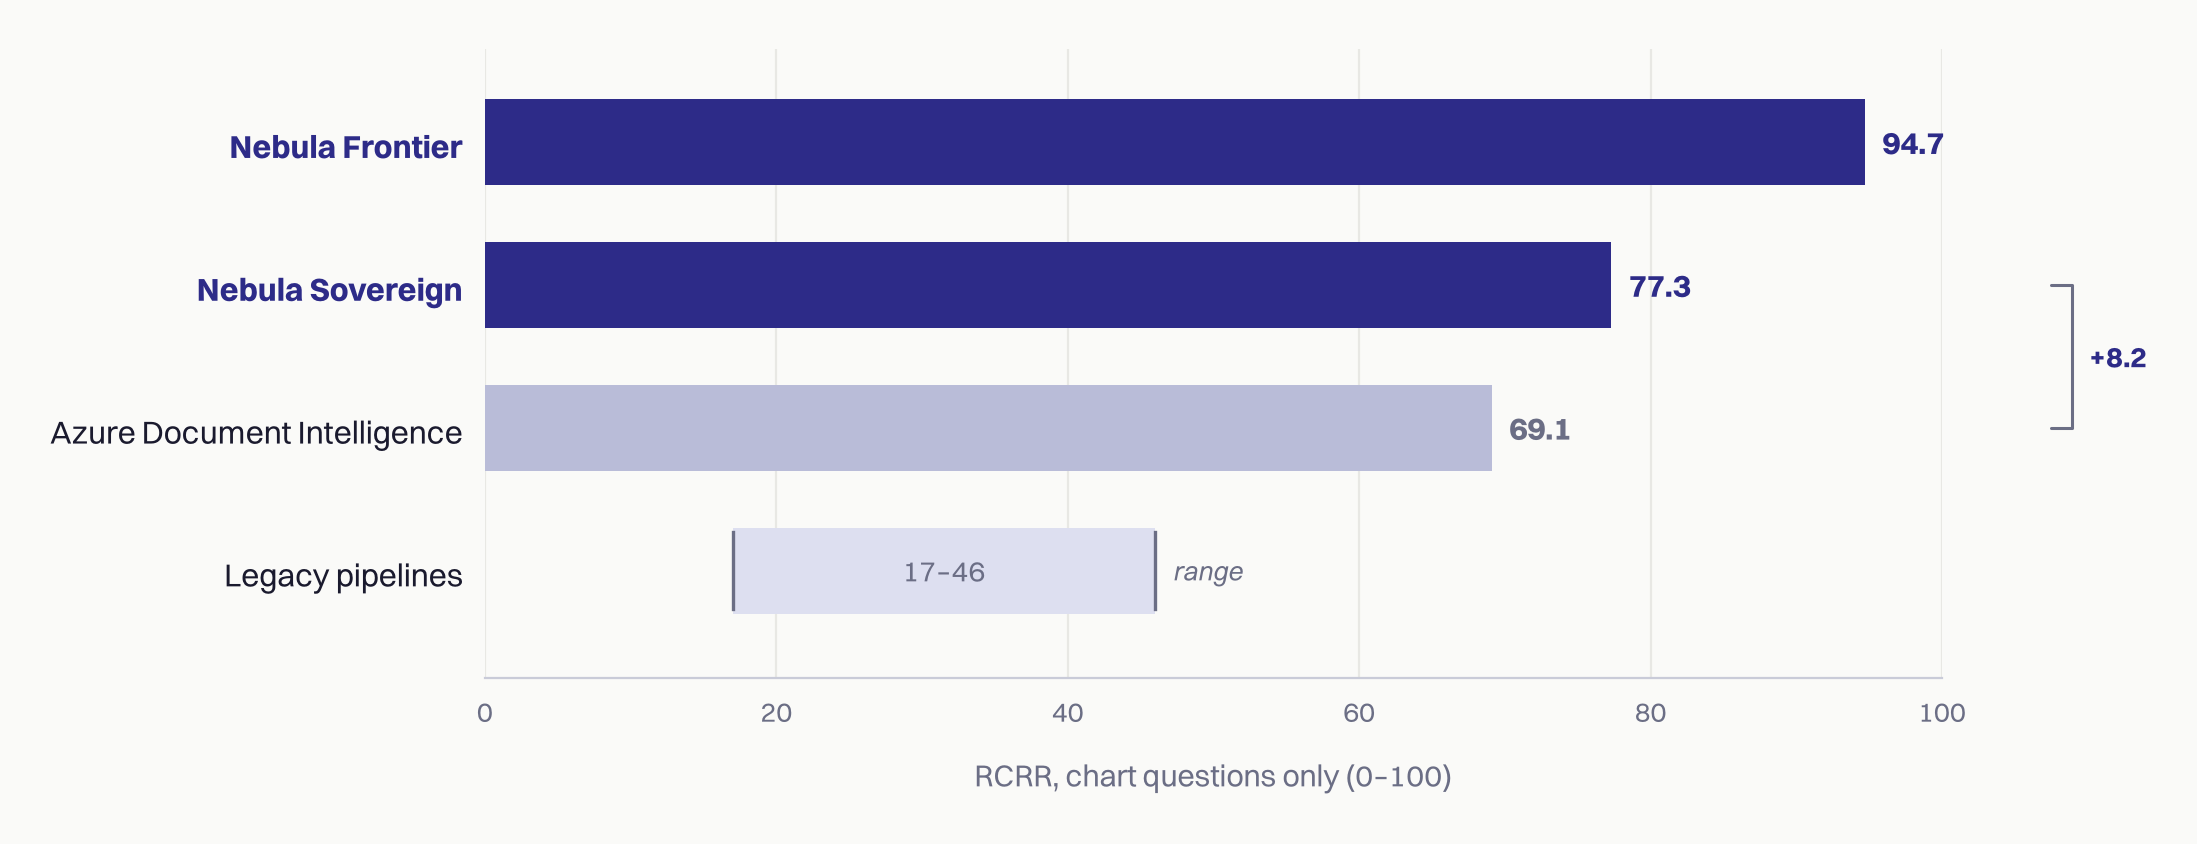
On the text-and-tables axis, systems have never been closer: 11 of 14 score above 74, and the top six sit within 3 points. The market separates in the charts column. Legacy pipelines collapse: Docling 17.1, Textract 17.4, Marker 17.6, Mistral OCR 22.2 (it writes figures out as image references, deleting the meaning wholesale), LlamaParse 34.1. Even Azure DI, world-class on tables, drops 22 points from its text score to 69.1: its figure output lists characters in reading order, and attribution ends there. VLM-based conversion is qualitatively different: frontier VLM APIs retain 94–98, Nebula Frontier retains 94.7, and among systems that run without any external API, Nebula Sovereign’s 77.3 outperforms every document OCR product evaluated.
6. Fine-tuning works: a measurement, not a claim
| Overall | Text & tables | Charts | |
|---|---|---|---|
| Qwen3-VL-32B base | 81.1 | 80.9 | 82.4 |
| Nebula Sovereign | 87.3 | 89.0 | 77.3 |
| Δ | +6.2 (significant) | +8.1 (significant) | −5.1 (n.s.) |
The identical benchmark, run on the base and the fine-tuned model. The only difference is the weights.
What fine-tuning bought is the +8.1 points on text and tables (coverage, numeric fidelity, table faithfulness), lifting a mid-tier open model to statistical equivalence with the best commercial cloud OCR. What it cost is a measurable (though not statistically significant) share of the chart-attribution faithfulness the base model had out of the box. We publish the regression deliberately: a benchmark that can detect our own model’s weakness is also the instrument for fixing it.
7. Limitations and next steps
- The frontier beyond text: roughly half of real Japanese IR chart pages print no data labels at all: content readable only from geometry. Those questions are excluded as unfair to every text pipeline; in exploratory runs, frontier VLMs answered 40–72% of them by estimating values, while every OCR product scored near zero. The benchmark already contains the track to measure this next capability frontier.
- Strengthening Sovereign on charts: 149 extracted chart-attribution failures define the next training cycle, alongside evaluating newer generations of open-weight base models. The target is first to match the base model on chart mapping, then to exceed 90.
- Gold provenance and human-authored golds: what this benchmark could verify is limited to golds VLMs could author at page level, which is, by construction, biased toward what VLMs can read. The next step is human-authored golds: the questions humans can answer but VLMs struggle with are precisely the next capability gap to measure.
- Scale: with 99 pages (48 chart pages), chart-mapping confidence intervals run ±8–9. Future releases will expand the page set.
- Data sources: both the benchmark corpus and the fine-tuning data consist of publicly available documents, primarily TDnet disclosures, and the two do not overlap: none of the 99 benchmark pages appears in the training data, so the measured fine-tuning effect reflects capability on unseen documents, not memorization.
Appendix: more worked examples
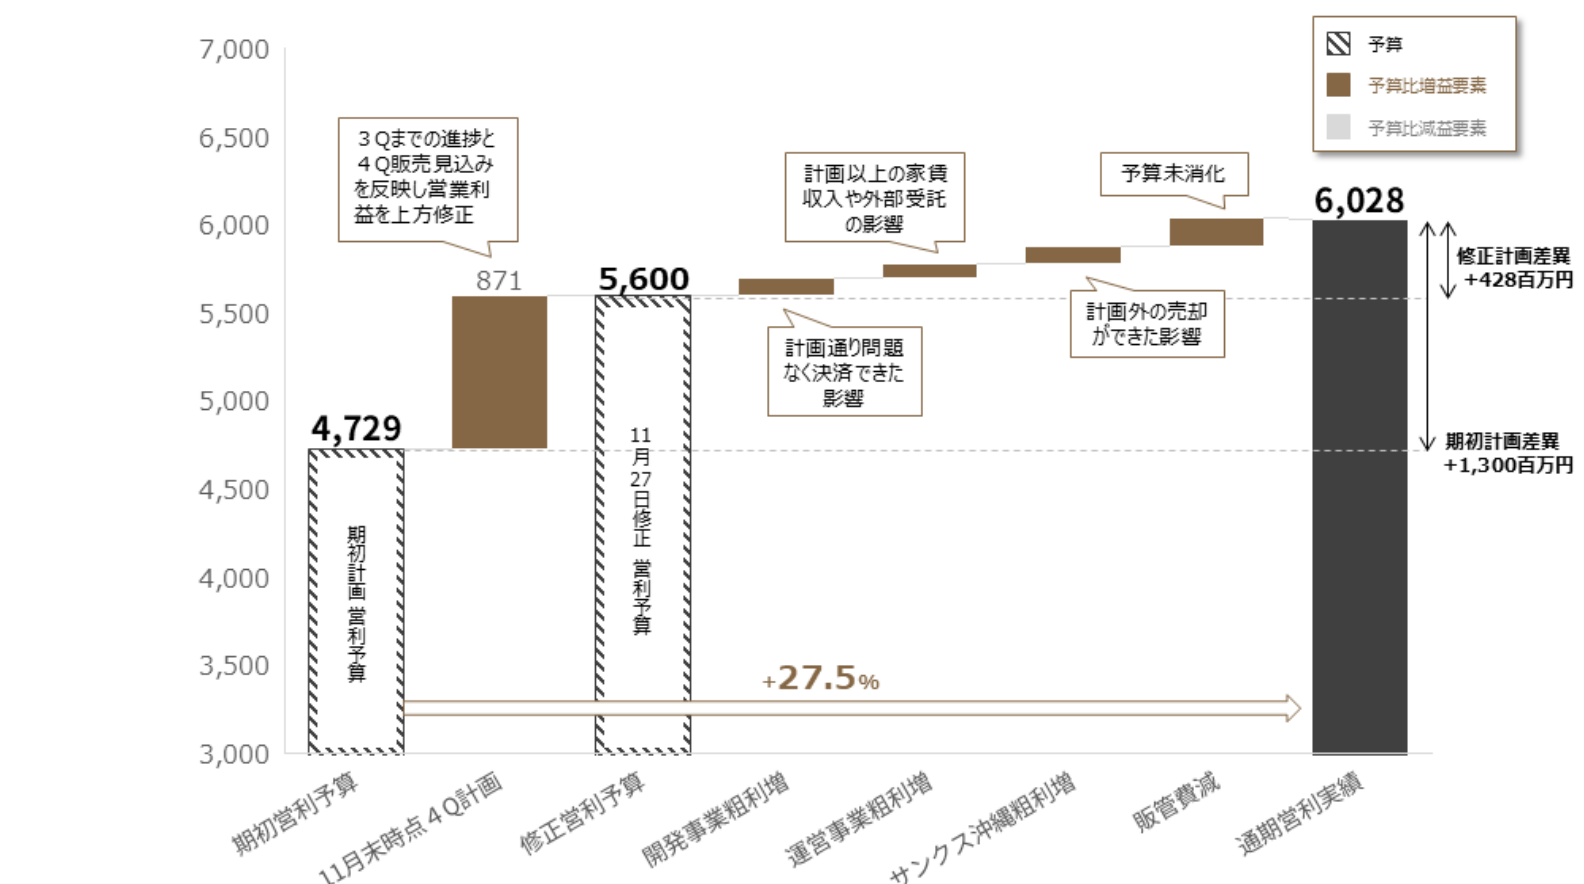
| System | Answer | Score | Failure type |
|---|---|---|---|
| GPT-5.6 Sol / Fable 5 / Gemini 3.1 Pro | 871 million yen | 2 | none |
| Nebula Frontier | 5,600 million yen | 0 | misattribution: answers the adjacent revised-plan bar |
| Azure DI | No information | 0 | disassociation |
| Nebula Sovereign | 4,729 million yen | 0 | misattribution |
| Qwen3-VL-32B base | 4,729 million yen | 0 | the same misattribution as its fine-tuned successor |
| Textract / Docling | No information | 0 | omission |
On this question, several systems, including Nebula Frontier, fail in their own characteristic ways. Publishing our own product’s failure unedited is part of the proof that this benchmark is not soft on its author.
The scoring rubric (0/1/2 with explicit rules for Japanese financial-unit conversion, “not stated” golds, language neutrality, and a score cap when a correct value is accompanied by a contradiction) was calibrated on a stratified pilot before any system was scored. Mapping questions were authored under strict rules: never include the needed value in the question; the answer must be printed on the page; chart questions must be answerable from chart ink alone, then machine-validated, audited by two model families against the page images, and human-reviewed item by item.
The public benchmark data (github.com/ur-ai-net/rcrr-bench) contains every question, every gold answer, per-question results for all systems under both Readers and both Judges, the audit and contamination-control outputs, and the full evaluation harness: every number in this report can be recomputed offline. Nebula Frontier is live at nebula.ur-ai.net; API documentation at ocr.ur-ai.net/docs.
Frequently Asked Questions
What does RCRR stand for?
RCRR stands for reading-comprehension recovery. It measures the share of answerable meaning that survives document conversion: a Reader model answers verified questions using only the converted Markdown, and an independent Judge scores the answers against verified gold answers on a calibrated 0/1/2 rubric.
What are the three failure types of document conversion?
Omission: the fact never reaches the Markdown at all. Disassociation: every character survives but the connections between labels and values are lost, the classic failure of layout OCR. Misattribution: the structure looks clean but one association is silently wrong, the classic failure of generative conversion, and the most expensive, because it produces a confident wrong answer instead of a refusal.
How is provenance bias handled in the RCRR Benchmark?
The gold answers were authored with VLM assistance (Gemini 3.1 Pro for text and tables, Fable 5 for charts, all human-reviewed), so the evaluation configuration deliberately breaks provenance: the Reader is a third model family (GPT-5.4-mini) and the Judge a different family from the Reader (Gemini 3.5 Flash). Parsers from the gold-authoring families appear in the results with their provenance explicitly disclosed, and the body claims are built on provenance-clean comparisons.