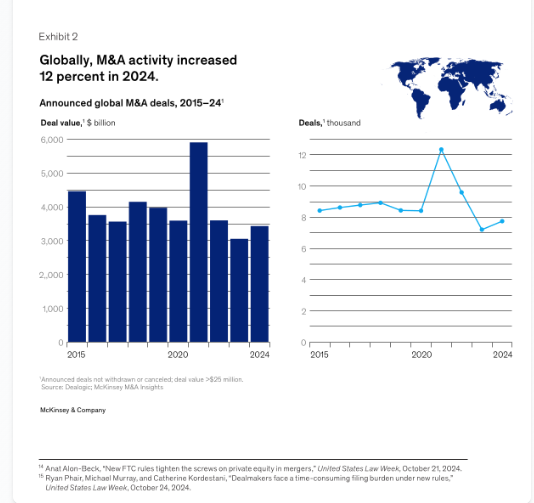
Nebula · Document Intelligence

Document intelligence for LLM-ready data.

Nebula converts PDFs, scanned images, charts, presentations, financial statements, handwritten documents, and business records into Markdown and structured JSON your LLMs, RAG pipelines, and agents can actually use. 90+ languages supported, Japanese-strong, and 100% Japan-hosted — customer documents never leave Japan.

Sample
IPCC AR6 Figure SPM.5 — Global emissions pathways
Nebula output

Page 1

<!-- page-background: white -->

Summary for Policymakers

Limiting warming to 1.5°C and 2°C involves rapid, deep and in most cases immediate greenhouse gas emission reductions

Net zero CO₂ and net zero GHG emissions can be achieved through strong reductions across all sectors


Chart a) Net global greenhouse gas (GHG) emissions

{
  "type": "line",
  "data": {
    "labels": ["2000", "2020", "2040", "2060", "2080", "2100"],
    "datasets": [
      {
        "label": "Implemented policies (median)",
        "data": [40, 60, 60, 60, 60, 60],
        "borderColor": "#d62728",
        "fill": false,
        "pointRadius": 0
      },
      {
        "label": "Implemented policies (25-75% percentiles)",
        "data": [40, 60, 60, 60, 60, 60],
        "borderColor": "#d62728",
        "fill": true,
        "backgroundColor": "rgba(214, 39, 40, 0.2)",
        "pointRadius": 0
      },
      {
        "label": "Implemented policies (5-95% percentiles)",
        "data": [40, 60, 60, 60, 60, 60],
        "borderColor": "#d62728",
        "fill": true,
        "backgroundColor": "rgba(214, 39, 40, 0.1)",
        "pointRadius": 0
      },
      {
        "label": "Limit warming to 2°C (>67%)",
        "data": [40, 55, 20, 10, 5, 0],
        "borderColor": "#7f8c8d",
        "fill": true,
        "backgroundColor": "rgba(127, 140, 141, 0.2)",
        "pointRadius": 0
      },
      {
        "label": "Limit warming to 1.5°C (>50%) with no or limited overshoot",
        "data": [40, 50, 15, 5, 0, 0],
        "borderColor": "#3498db",
        "fill": true,
        "backgroundColor": "rgba(52, 152, 219, 0.2)",
        "pointRadius": 0
      },
      {
        "label": "Past emissions (2000–2015)",
        "data": [40, 55, 55, 55, 55, 55],
        "borderColor": "#000000",
        "fill": false,
        "pointRadius": 0
      }
    ]
  },
  "options": {
    "scales": {
      "y": {
        "title": {
          "display": true,
          "text": "Gigatons of CO₂-equivalent emissions (GtCO₂-eq/yr)"
        },
        "beginAtZero": false,
        "ticks": {
          "stepSize": 20
        }
      },
      "x": {
        "title": {
          "display": true,
          "text": "Year"
        }
      }
    },
    "plugins": {
      "title": {
        "display": true,
        "text": "a) Net global greenhouse gas (GHG) emissions"
      },
      "annotation": {
        "annotations": {
          "note1": {
            "type": "label",
            "xValue": 2020,
            "yValue": 60,
            "content": "2019 emissions were 12% higher than 2010",
            "font": {
              "size": 10
            },
            "align": "start",
            "caretPadding": 10,
            "arrowHeadWidth": 10,
            "arrowHeadHeight": 10,
            "arrowBodyWidth": 5
          },
          "note2": {
            "type": "label",
            "xValue": 2030,
            "yValue": 55,
            "content": "Nationally Determined Contributions (NDCs) range in 2030",
            "font": {
              "size": 10
            },
            "align": "start"
          },
          "note3": {
            "type": "label",
            "xValue": 2080,
            "yValue": 70,
            "content": "Implemented policies result in projected emissions that lead to warming of 3.2°C, with a range of 2.2°C to 3.5°C (medium confidence)",
            "font": {
              "size": 10
            },
            "align": "start"
          }
        }
      }
    },
    "legend": {
      "display": false
    }
  },
  "key": {
    "implemented_policies": "Implemented policies (median, with percentiles 25-75% and 5-95%)",
    "limit_2c": "Limit warming to 2°C (>67%)",
    "limit_15c": "Limit warming to 1.5°C (>50%) with no or limited overshoot",
    "past_emissions": "Past emissions (2000–2015)",
    "model_range": "Model range for 2015 emissions",
    "uncertainty": "Past GHG emissions and uncertainty for 2015 and 2019 (dot indicates the median)"
  }
}

Caption: a) Net global greenhouse gas (GHG) emissions
Source: IPCC AR6 WGIII Summary for Policymakers


Chart b) Net global CO₂ emissions

{
  "type": "line",
  "data": {
    "labels": ["2000", "2020", "2040", "2060", "2080", "2100"],
    "datasets": [
      {
        "label": "Implemented policies (median)",
        "data": [40, 40, 40, 40, 40, 40],
        "borderColor": "#d62728",
        "fill": false,
        "pointRadius": 0
      },
      {
        "label": "Implemented policies (25-75% percentiles)",
        "data": [40, 40, 40, 40, 40, 40],
        "borderColor": "#d62728",
        "fill": true,
        "backgroundColor": "rgba(214, 39, 40, 0.2)",
        "pointRadius": 0
      },
      {
        "label": "Implemented policies (5-95% percentiles)",
        "data": [40, 40, 40, 40, 40, 40],
        "borderColor": "#d62728",
        "fill": true,
        "backgroundColor": "rgba(214, 39, 40, 0.1)",
        "pointRadius": 0
      },
      {
        "label": "Limit warming to 2°C (>67%)",
        "data": [40, 40, 20, 10, 5, 0],
        "borderColor": "#7f8c8d",
        "fill": true,
        "backgroundColor": "rgba(127, 140, 141, 0.2)",
        "pointRadius": 0
      },
      {
        "label": "Limit warming to 1.5°C (>50%) with no or limited overshoot",
        "data": [40, 40, 15, 5, 0, 0],
        "borderColor": "#3498db",
        "fill": true,
        "backgroundColor": "rgba(52, 152, 219, 0.2)",
        "pointRadius": 0
      },
      {
        "label": "Past emissions (2000–2015)",
        "data": [40, 40, 40, 40, 40, 40],
        "borderColor": "#000000",
        "fill": false,
        "pointRadius": 0
      }
    ]
  },
  "options": {
    "scales": {
      "y": {
        "title": {
          "display": true,
          "text": "GtCO₂/yr"
        },
        "beginAtZero": false,
        "ticks": {
          "stepSize": 20
        }
      },
      "x": {
        "title": {
          "display": true,
          "text": "Year"
        }
      }
    },
    "plugins": {
      "title": {
        "display": true,
        "text": "b) Net global CO₂ emissions"
      },
      "annotation": {
        "annotations": {
          "note1": {
            "type": "label",
            "xValue": 2020,
            "yValue": 40,
            "content": "Nationally Determined Contributions (NDCs) range in 2030",
            "font": {
              "size": 10
            },
            "align": "start"
          }
        }
      }
    },
    "legend": {
      "display": false
    }
  }
}

Caption: b) Net global CO₂ emissions
Source: IPCC AR6 WGIII Summary for Policymakers


Chart c) Global methane (CH₄) emissions

{
  "type": "line",
  "data": {
    "labels": ["2000", "2020", "2040", "2060", "2080", "2100"],
    "datasets": [
      {
        "label": "Implemented policies (median)",
        "data": [400, 400, 400, 400, 400, 400],
        "borderColor": "#d62728",
        "fill": false,
        "pointRadius": 0
      },
      {
        "label": "Implemented policies (25-75% percentiles)",
        "data": [400, 400, 400, 400, 400, 400],
        "borderColor": "#d62728",
        "fill": true,
        "backgroundColor": "rgba(214, 39, 40, 0.2)",
        "pointRadius": 0
      },
      {
        "label": "Implemented policies (5-95% percentiles)",
        "data": [400, 400, 400, 400, 400, 400],
        "borderColor": "#d62728",
        "fill": true,
        "backgroundColor": "rgba(214, 39, 40, 0.1)",
        "pointRadius": 0
      },
      {
        "label": "Limit warming to 2°C (>67%)",
        "data": [400, 400, 200, 150, 100, 50],
        "borderColor": "#7f8c8d",
        "fill": true,
        "backgroundColor": "rgba(127, 140, 141, 0.2)",
        "pointRadius": 0
      },
      {
        "label": "Limit warming to 1.5°C (>50%) with no or limited overshoot",
        "data": [400, 400, 150, 100, 50, 0],
        "borderColor": "#3498db",
        "fill": true,
        "backgroundColor": "rgba(52, 152, 219, 0.2)",
        "pointRadius": 0
      },
      {
        "label": "Past emissions (2000–2015)",
        "data": [400, 400, 400, 400, 400, 400],
        "borderColor": "#000000",
        "fill": false,
        "pointRadius": 0
      }
    ]
  },
  "options": {
    "scales": {
      "y": {
        "title": {
          "display": true,
          "text": "MtCH₄/yr"
        },
        "beginAtZero": false,
        "ticks": {
          "stepSize": 200
        }
      },
      "x": {
        "title": {
          "display": true,
          "text": "Year"
        }
      }
    },
    "plugins": {
      "title": {
        "display": true,
        "text": "c) Global methane (CH₄) emissions"
      }
    },
    "legend": {
      "display": false
    }
  }
}

Caption: c) Global methane (CH₄) emissions
Source: IPCC AR6 WGIII Summary for Policymakers


Chart d) Net zero CO₂ will be reached before net zero GHG emissions

{
  "type": "bar",
  "data": {
    "labels": ["2000", "2020", "2040", "2060", "2080", "2100"],
    "datasets": [
      {
        "label": "CO₂ (2°C)",
        "data": [0, 0, 0, 0, 0, 0],
        "backgroundColor": "#7f8c8d"
      },
      {
        "label": "GHG (2°C)",
        "data": [0, 0, 0, 0, 0, 0],
        "backgroundColor": "#7f8c8d"
      },
      {
        "label": "CO₂ (1.5°C)",
        "data": [0, 0, 0, 0, 0, 0],
        "backgroundColor": "#3498db"
      },
      {
        "label": "GHG (1.5°C)",
        "data": [0, 0, 0, 0, 0, 0],
        "backgroundColor": "#3498db"
      }
    ]
  },
  "options": {
    "scales": {
      "y": {
        "title": {
          "display": true,
          "text": "Year of net zero emissions"
        },
        "beginAtZero": true
      },
      "x": {
        "title": {
          "display": true,
          "text": "Year"
        }
      }
    },
    "plugins": {
      "title": {
        "display": true,
        "text": "d) Net zero CO₂ will be reached before net zero GHG emissions"
      },
      "legend": {
        "display": false
      }
    }
  }
}

Caption: d) Net zero CO₂ will be reached before net zero GHG emissions
Source: IPCC AR6 WGIII Summary for Policymakers


Chart e) Greenhouse gas emissions by sector at the time of net zero CO₂, compared to 2019

{
  "type": "bar",
  "data": {
    "labels": ["2019 comparison", "IMP-GS", "IMP-Neg", "IMP-LD", "IMP-SP", "IMP-Ren"],
    "datasets": [
      {
        "label": "Non-CO₂ emissions",
        "data": [10, 5, 5, 5, 5, 5],
        "backgroundColor": "#ffffff"
      },
      {
        "label": "Transport, industry and buildings",
        "data": [20, 10, 10, 10, 10, 10],
        "backgroundColor": "#4a4a8e"
      },
      {
        "label": "Energy supply (including electricity)",
        "data": [20, 10, 10, 10, 10, 10],
        "backgroundColor": "#4a8ebd"
      },
      {
        "label": "Land-use change and forestry",
        "data": [10, 5, 5, 5, 5, 5],
        "backgroundColor": "#4a8e6e"
      }
    ]
  },
  "options": {
    "scales": {
      "y": {
        "title": {
          "display": true,
          "text": "GtCO₂-eq/yr"
        },
        "beginAtZero": false,
        "ticks": {
          "stepSize": 20
        }
      },
      "x": {
        "title": {
          "display": true,
          "text": "Illustrative Mitigation Pathways (IMPs)"
        }
      }
    },
    "plugins": {
      "title": {
        "display": true,
        "text": "e) Greenhouse gas emissions by sector at the time of net zero CO₂, compared to 2019"
      },
      "annotation": {
        "annotations": {
          "note1": {
            "type": "label",
            "xValue": 3,
            "yValue": 40,
            "content": "these are different ways to achieve net-zero CO₂",
            "font": {
              "size": 10
            },
            "align": "center"
          }
        }
      }
    },
    "legend": {
      "display": false
    }
  },
  "key": {
    "non_co2": "Non-CO₂ emissions",
    "transport_industry_buildings": "Transport, industry and buildings",
    "energy_supply": "Energy supply (including electricity)",
    "land_use_change_forestry": "Land-use change and forestry"
  }
}

Caption: e) Greenhouse gas emissions by sector at the time of net zero CO₂, compared to 2019
Source: IPCC AR6 WGIII Summary for Policymakers

A 5-panel scientific figure from the IPCC Sixth Assessment Synthesis Report — multi-series line charts with confidence-interval bands across emissions scenarios. Each panel comes back as Chart.js-compatible JSON inline.

Why Nebula

Five reasons enterprises choose Nebula over generic OCR.

Each point below is anchored to a property of the product enterprises actually care about — output usability, document coverage, language strength, and data residency.

MD + JSONoutput

LLM-ready outputs by default

Every job emits a combined Markdown document for humans and a structured JSON payload for downstream pipelines. RAG, agents, and analytics consume Nebula output without custom parsing.

4document shapes

Charts, tables, handwritten, forms

Charts come back as structured chart data. Tables preserve hierarchy and merged cells. Handwritten documents are transcribed verbatim. Multi-section forms keep labels, line numbers, and checkboxes intact.

AsyncAPI

Built for enterprise batches

Upload single files or whole folders. Jobs run independently with batch-level status, partial-success retries, and per-job audit metadata. Designed for ingesting large document estates, not single-file demos.

90+languages

Japanese-strong, multilingual

Tuned for Japanese corporate, legal, and financial documents. Handles mixed JP/EN layouts, bilingual tables, and 90+ languages without separate model selection.

100%Japan-hosted

Sovereign by design

Documents are processed and stored exclusively in Japan. No customer document content is ever sent outside the country. No data sharing. No external training.

Sovereignty & trust

Built so document data never leaves Japan.

Nebula is engineered around data residency from day one. Documents are processed and stored in Japan, never used for external model training, and never shared with third parties. Every job carries an audit trail your security and finance teams can pull on demand.

Documents stay in Japan
Source uploads, intermediate artifacts, and final Markdown are all processed and stored in Japan. Customer document content never leaves the country.
No data sharing or training
Your documents are not used to train external models, are not shared with third parties, and are not exposed to any service outside Nebula.
API-key authentication
Every API call is authenticated with a per-customer key. Credentials, jobs, and results are scoped to your tenant — never visible to anyone else.
Per-job audit trail
Each job records timing, status, page-level outcome, and retry attempts — exportable to your security and finance teams whenever you need it.
100% Japan-resident
Uploads, processing, and outputs all stay in-country.
  • Documents processed and stored in Japan
  • Customer data never leaves Japan
  • Not used to train external models
  • Per-customer API key authentication
  • Per-job audit trail for security & finance

Your security, legal, and procurement teams get a single, simple answer on data residency: documents you send to Nebula stay in Japan, end to end.

Use cases

One layer for many document workflows.

Use Nebula wherever business knowledge needs to move from visual documents into AI systems — RAG, agents, analytics, and downstream LLM pipelines.

01

Japanese financial documents

Convert annual reports, governance materials, IR releases, and disclosure filings into structured AI inputs without losing Japanese-specific layout details.

02

Bank statements, expenses, invoices

Turn issuer-specific statement layouts and back-office documents into normalized line items so accounting and reconciliation agents can act on them.

03

Board decks & business presentations

Extract slide structure, narrative, tables, and chart series from PowerPoint exports without flattening the visual context into unreliable text.

04

Data rooms & RAG ingestion

Prepare large enterprise PDF estates for retrieval, summarization, diligence, and agentic workflows. Batch upload, parallel jobs, partial-success retries.

05

Legal & regulatory corpora

Ingest long Japanese legal PDFs with footnotes and citations preserved in reading order, ready for downstream contract review or compliance agents.

Quality & validation

We evaluate for downstream AI-readiness, not surface text matching.

Surface character accuracy is a floor, not a ceiling. We validate Nebula on whether its output actually supports real LLM workflows — question answering, table reasoning, chart interpretation, and Japanese business document understanding.

Downstream LLM answerability
Can a model answer real business questions from Nebula output?
Structure & reading order
Headings, hierarchy, lists, footnotes preserved end-to-end.
Tables & charts as data
Numerical fidelity, JSON series — not flattened text.
Japanese & multilingual
Strong on Japanese business and legal documents.
FAQ

Frequently asked questions about Nebula.

What Nebula is, how it processes documents, where the data lives, and how to integrate.

Try Nebula

Turn your documents into LLM-ready data.

Sign in, upload a document, and get Markdown plus structured JSON in minutes. No demo required — try Nebula directly with your own files.

100% Japan-hosted — data never leaves Japan
Markdown + structured JSON output for RAG and agents
Tuned for Japanese financial, legal, and business documents