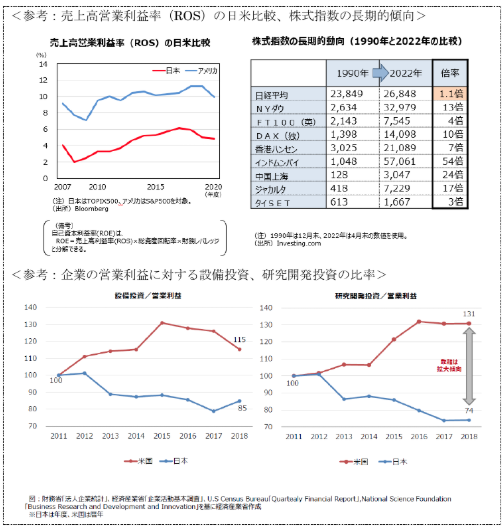
<参考:売上高営業利益率(ROS)の日米比較、株式指数の長期的傾向>
{
  "type": "line",
  "data": {
    "labels": ["2007", "2008", "2009", "2010", "2011", "2012", "2013", "2014", "2015", "2016", "2017", "2018", "2019", "2020"],
    "datasets": [
      {
        "label": "日本",
        "data": [4, 2, 3, 3, 3, 4, 4, 5, 5, 6, 5, 5, 5, 5],
        "borderColor": "red",
        "fill": false
      },
      {
        "label": "アメリカ",
        "data": [10, 7, 8, 10, 9, 10, 10, 10, 11, 11, 11, 11, 11, 10],
        "borderColor": "blue",
        "fill": false
      }
    ]
  },
  "options": {
    "scales": {
      "y": {
        "title": {
          "display": true,
          "text": "%"
        },
        "beginAtZero": true,
        "ticks": {
          "stepSize": 2
        }
      },
      "x": {
        "title": {
          "display": true,
          "text": "(年度)"
        }
      }
    },
    "plugins": {
      "title": {
        "display": true,
        "text": "売上高営業利益率(ROS)の日米比較"
      },
      "legend": {
        "position": "top"
      }
    },
    "responsive": true,
    "maintainAspectRatio": false
  },
  "caption": "(注)日本はTOPIX500、アメリカはS&P500を対象。\n(出所)Bloomberg",
  "notes": "(備考)自己資本利益率(ROE)は、ROE = 売上高利益率(ROS) × 総資産回転率 × 財務レバレッジと分解できる。"
}
{
  "type": "table",
  "data": {
    "headers": ["", "1990年", "2022年", "倍率"],
    "rows": [
      ["日経平均", "23,849", "26,848", "1.1倍"],
      ["NYダウ", "2,634", "32,979", "13倍"],
      ["FT100(英)", "2,143", "7,545", "4倍"],
      ["DAX(独)", "1,398", "14,098", "10倍"],
      ["香港ハンセン", "3,025", "21,089", "7倍"],
      ["インドムンバイ", "1,048", "57,061", "54倍"],
      ["中国上海", "128", "3,047", "24倍"],
      ["ジャカルタ", "418", "7,229", "17倍"],
      ["タイSET", "613", "1,667", "3倍"]
    ]
  },
  "options": {
    "title": "株式指数の長期的動向(1990年と2022年の比較)",
    "footer": "(注)1990年は12月末、2022年は4月末の数値を使用。\n(出所)Investing.com"
  },
  "alignment": {
    "column \"1990年\"": "right",
    "column \"2022年\"": "right",
    "column \"倍率\"": "right"
  }
}
<参考:企業の営業利益に対する設備投資、研究開発投資の比率>
{
  "type": "line",
  "data": {
    "labels": ["2011", "2012", "2013", "2014", "2015", "2016", "2017", "2018"],
    "datasets": [
      {
        "label": "米国",
        "data": [100, 105, 110, 112, 115, 130, 128, 115],
        "borderColor": "brown",
        "fill": false
      },
      {
        "label": "日本",
        "data": [100, 100, 90, 88, 88, 88, 80, 85],
        "borderColor": "blue",
        "fill": false
      }
    ]
  },
  "options": {
    "scales": {
      "y": {
        "title": {
          "display": true,
          "text": ""
        },
        "beginAtZero": false,
        "ticks": {
          "stepSize": 10
        }
      },
      "x": {
        "title": {
          "display": true,
          "text": ""
        }
      }
    },
    "plugins": {
      "title": {
        "display": true,
        "text": "設備投資/営業利益"
      },
      "legend": {
        "position": "bottom"
      }
    },
    "responsive": true,
    "maintainAspectRatio": false
  },
  "caption": "",
  "notes": ""
}
{
  "type": "line",
  "data": {
    "labels": ["2011", "2012", "2013", "2014", "2015", "2016", "2017", "2018"],
    "datasets": [
      {
        "label": "米国",
        "data": [100, 100, 105, 107, 108, 120, 130, 131],
        "borderColor": "brown",
        "fill": false
      },
      {
        "label": "日本",
        "data": [100, 100, 88, 88, 88, 85, 74, 74],
        "borderColor": "blue",
        "fill": false
      }
    ]
  },
  "options": {
    "scales": {
      "y": {
        "title": {
          "display": true,
          "text": ""
        },
        "beginAtZero": false,
        "ticks": {
          "stepSize": 10
        }
      },
      "x": {
        "title": {
          "display": true,
          "text": ""
        }
      }
    },
    "plugins": {
      "title": {
        "display": true,
        "text": "研究開発投資/営業利益"
      },
      "legend": {
        "position": "bottom"
      }
    },
    "responsive": true,
    "maintainAspectRatio": false
  },
  "caption": "",
  "notes": "乖離は拡大傾向",
  "visual_annotations": [
    "[arrow: down gray] (from 131 to 74)"
  ]
}
図:財務省「法人企業統計」、経済産業省「企業活動基本調査」、U.S Census Bureau「Quarterly Financial Report」、National Science Foundation 「Business Research and Development and Innovation」を基に経済産業省作成 ※日本は年度、米国は暦年
<!-- page-background: white -->